
Where $110B of climate capital is actually heading.
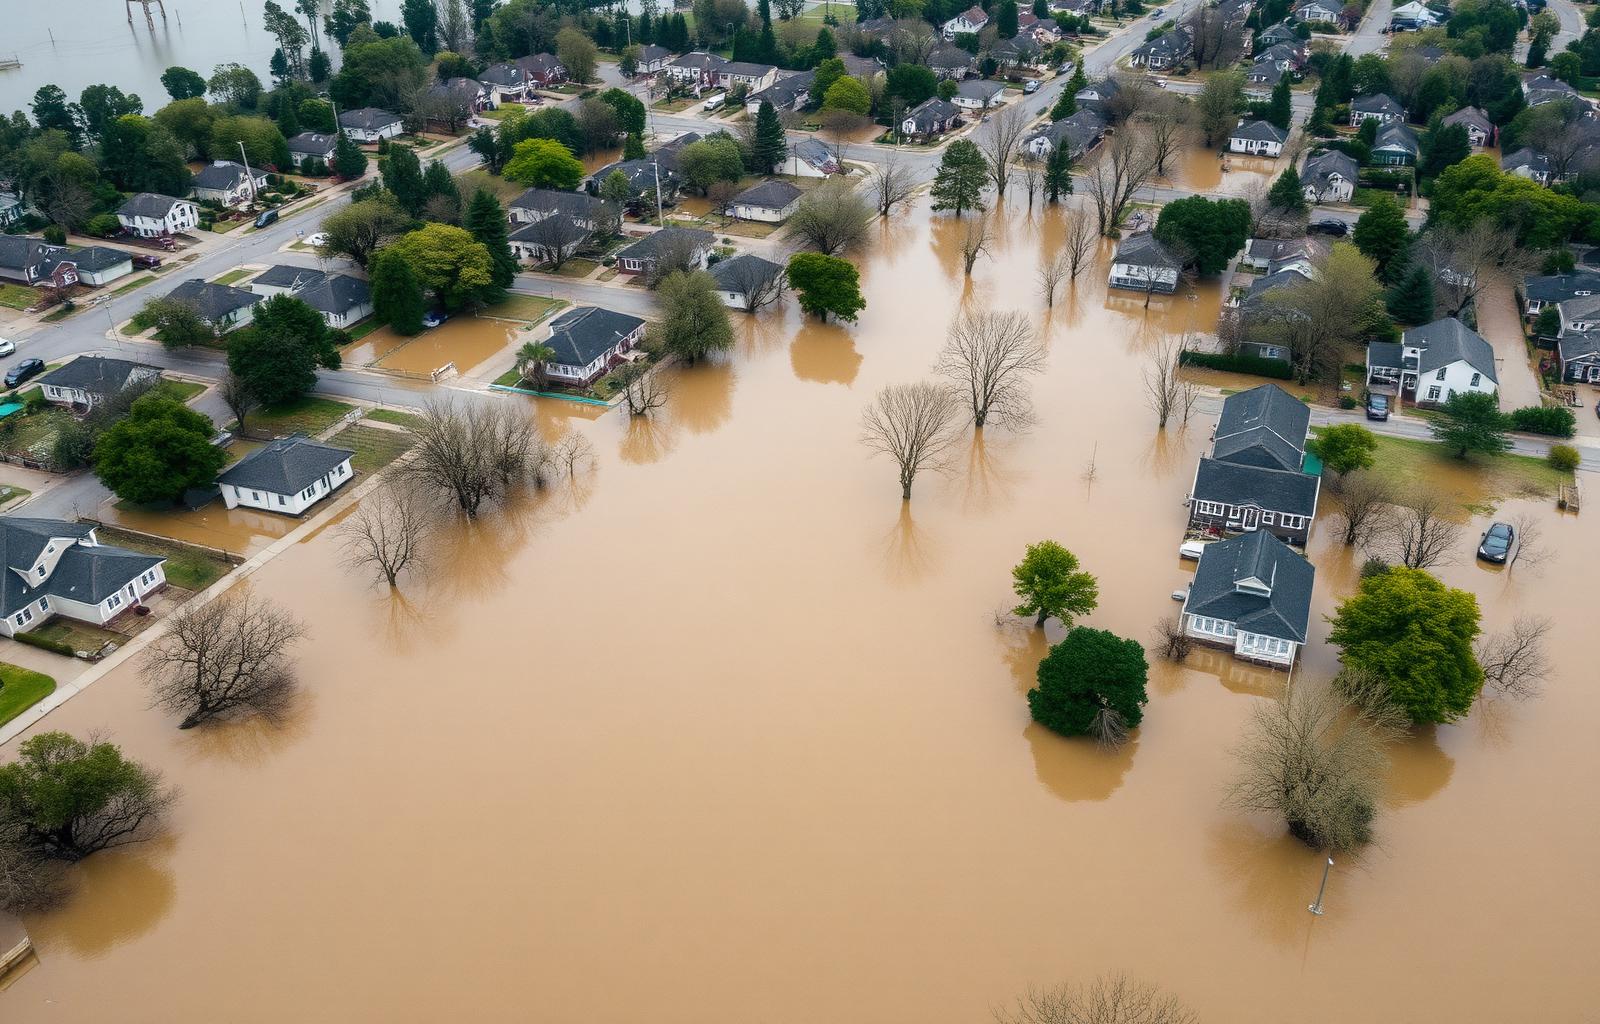
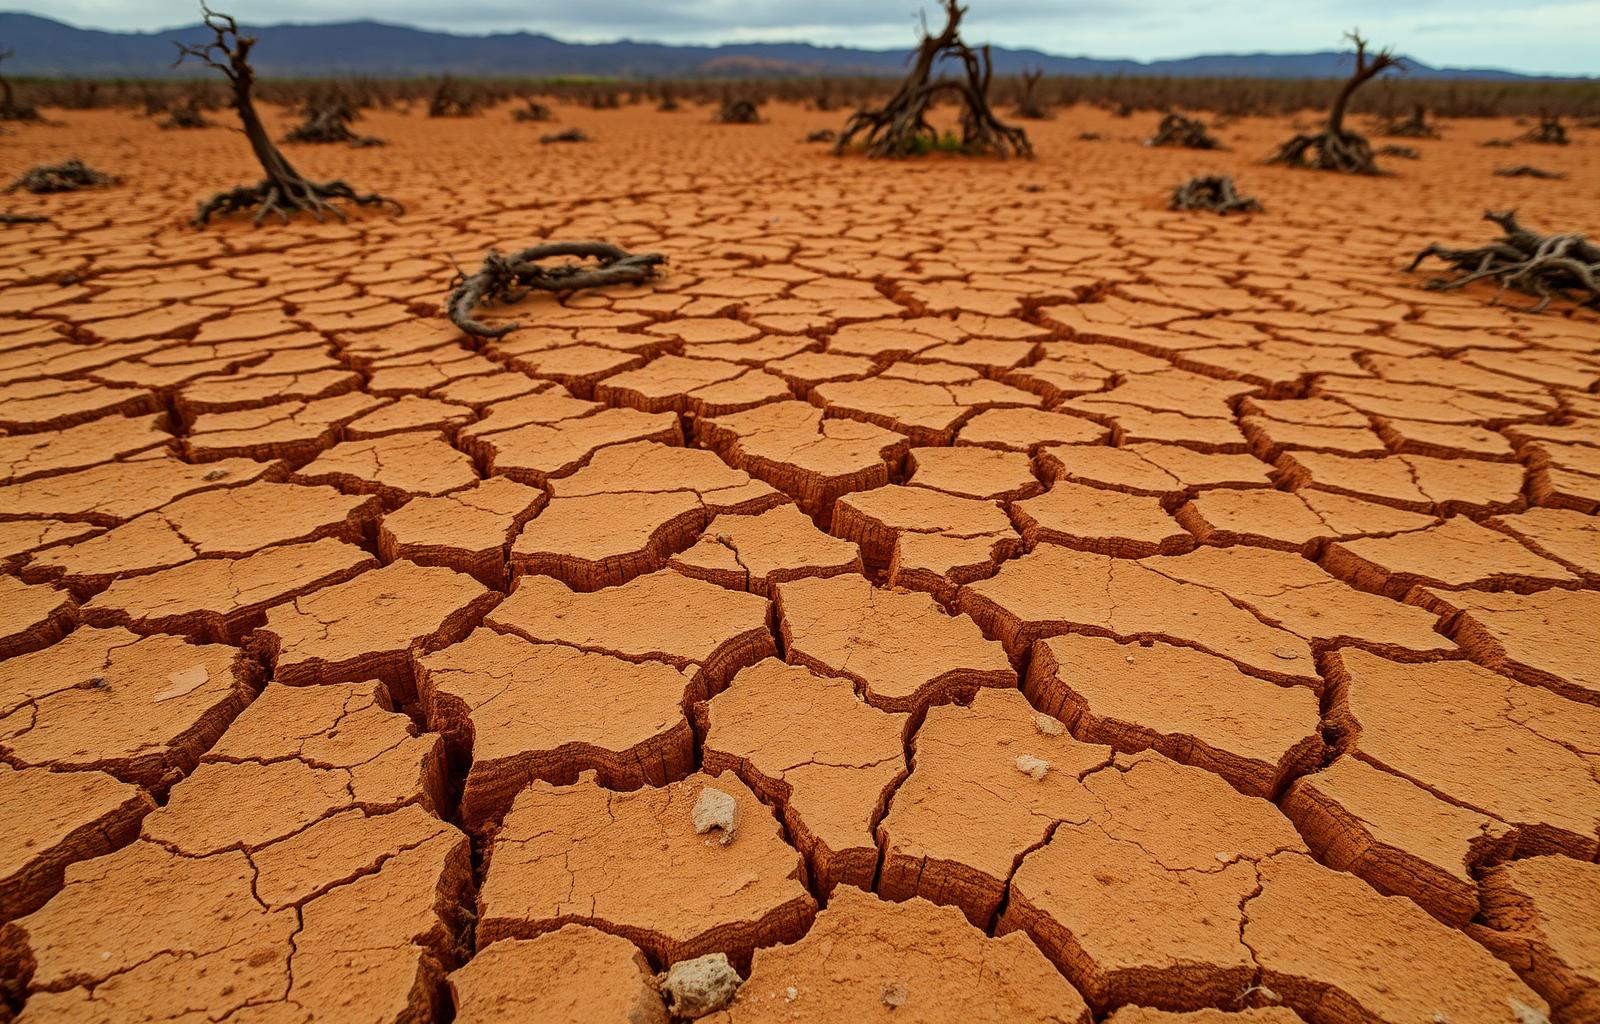
The defining climate risk of the coming decade is hydroclimatic risk — floods, droughts, storms, sea-level rise, and the cascading hazards they trigger. Hydroclimatic risk technology is the data and decision layer that helps capital, infrastructure, and operators measure, manage, and price those hazards. Its demand is compelled, its economics are increasingly software-shaped, and the category remains open enough for specialist investors and early-stage companies to define.
Bottom-up build across F.I.RE., linear assets, coastal infrastructure, and power generation. Excludes the $900B water industry.

This is not the water industry.
The traditional water industry — utilities, pipes, treatment plants, pumps — is a ~$900B market doing essential work through mature, capital-intensive business models. Mazarine Climate focuses elsewhere: the separate, software-heavy intelligence layer serving insurers, banks, operators, and asset owners compelled to understand the risk water creates for physical assets.
- ~$900B mature market
- Pipes, pumps, treatment, utilities
- Strategic incumbents, low growth
- Capex-heavy, project economics
- Muted venture returns
- $45B → $110B (2024 → 2030)
- Risk analytics, sensing, EO, decision software
- Software-heavy, ARR economics
- Non-discretionary, regulator-forced demand
- Built for early-stage venture returns
Four sectors. One forcing function.
Built from published buyer-pool counts, average tech spend per buyer, and climate-exposure penetration rates. Sources include Swiss Re, Munich Re, McKinsey, JLL, Deloitte, MSCI, WRI, UNCTAD, and J.P. Morgan.
Regulation, insurance, and balance sheets — not subsidy — drive the curve.
These are three independent forcing functions. A regulated institution must disclose, an insurer must reprice, and an exposed operator must protect cash flow — producing recurring demand that does not depend on goodwill or a sustainability budget.
Disclosure is now mandatory
ISSB / IFRS S2, CSRD, TCFD, and EU CLARION put physical risk on the balance sheet. EU-funded infrastructure projects legally require climate-risk assessment.
Protection is repricing fast
92% of 2025 insured nat-cat losses came from secondary perils (Munich Re). Carriers are withdrawing from markets and reinsurers are pricing forward.
Every $1 saves $4–6 in damages
World Bank / Hallegatte. Linear asset operators face TCFD/CSRD physical-risk disclosure. JLL: climate risk in lending decisions has doubled in five years.
Downtime is already here
$67B in trade at risk annually from climate-driven port downtime (ICS). India lost $350M+ from drought-induced coal generation in 2016. 86% of global ports face three or more climate hazards.
Three technology layers. Mapped to our four sectors of focus.
See — sensing & observation
Satellite, airborne, IoT, and ground-truth networks that turn physical hazards into continuous, machine-readable signals across basins, assets, and supply chains.
Understand — analytics & prediction
Physics + AI models, catastrophe modelling, digital twins, and risk analytics that translate raw signals into asset-, portfolio-, and basin-level risk. 17.8% CAGR (Technavio).
Act — decision & automation
Decision software, underwriting copilots, parametric risk-transfer infrastructure, and the workflow layer that wires risk intelligence into the systems of record.
Sized for a specialist fund.
$110B by 2030 is large enough to support a specialist venture fund, and a 16.1% CAGR is sufficient to deliver venture-scale returns. The buyer pool sits outside the slow-growth traditional water industry.
Much of the growth sits in risk analytics and the software value added to remote sensing: high-margin, recurring products sold to enterprise buyers. We believe this is the most investable corner of climate adaptation for an early-stage fund of our size and scope — defended by regulatory, insurance, and balance-sheet drivers that do not depend on subsidy or policy goodwill.